Heka, InfluxDB, and Grafana
I recently started working at a startup :). My first task there was to configure their new Linux server to host some live apps. I, professionally, haven’t done sysadmin work but since I’ve been configuring Linux VPSs to play with for some time now I figured it wouldn’t be that hard doing the initial setup. I did the usual; install and configure the necessary packages, firewall stuff, automated deployment of the apps, and of course, monitoring. I tried to do as much as possible on Ansible–I’m no idiot.
Settling on what I should use for monitoring took quite some time. There a so many ways you can kill this rat; Logstash, Gaphite, Prometheus, Heka, and the list goes on and on. I knew, however, what I wanted:
- Easily deployable–mainly because I didn’t want to have to do a lot of work on Ansible
- Monitors both live stats and log files
- Can run as a daemon
- Has (or supports) a sexy graph dashboard
Prometheus and Heka came up top. Prometheus comes bundled with an integrated time-series database and a graph dashboard. Heka, on the other hand, only collects and processes the time-series data. It might look like Prometheus has a leg up on Heka (it probably does in most use-cases). Using Prometheus, however, means that you have to use everything Prometheus. I hate being locked down–hey boo ;)! Heka supports a variety of data outputs including a host of storage engines (InfluxDB being one of them), IRC, ElasticSearch, HTTP, etc. Grafana can graph data stored in an InfluxDB database. InfluxDB and Grafana are also very easy to install and run as daemons. Sorted!
Note: Currently, the latest versions for both Heka and InfluxDB are pre v1 (v0.10.0 for Heka and v0.9.6 for InfluxDB). Both are also very young projects. I have however not experienced any issues with my setup. Live a little!
Configuration
I will focus on configuring Heka. Props to the Heka team for providing such awesome documentation. As for InfluxDB, all you need to do is to create the user and databases to be used by Heka. Here’s a good tutorial on how to configure Grafana with InfluxDB.
Heka works as a system of user-defined plugins with each plugin handling a step in the monitoring process. Here’s a list of the steps:
- Input
- Splitting–This is an optional step and I have honestly not used it yet.
- Decode
- Filter
- Encode
- Output
What’s cool is that you can mix and match plugin types depending on, for instance, what your input is.
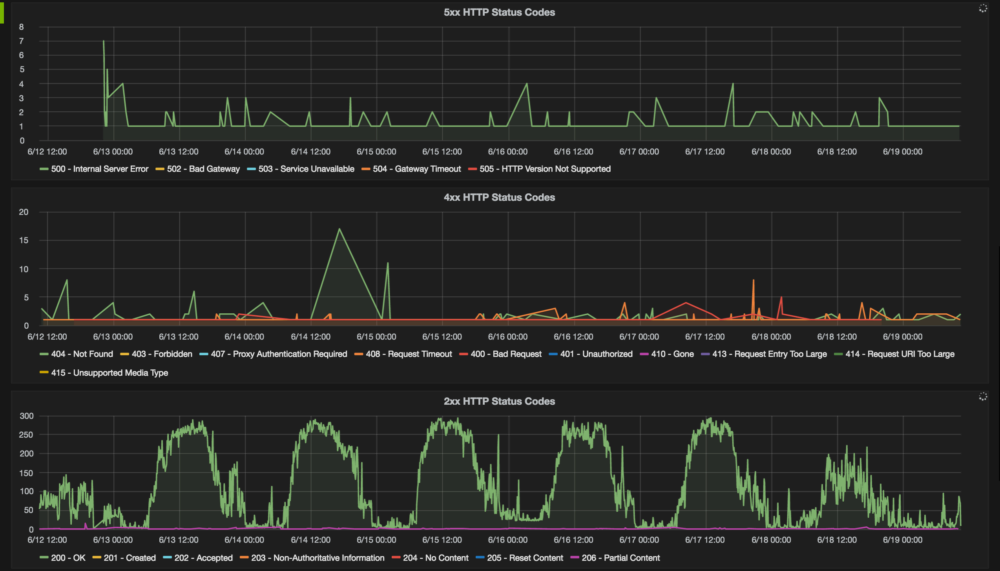
As an example, I’ll show how I configured Heka to monitor HTTP status codes. All the configuration snippets for the different steps below are actually part of one configuration file (http_status.toml) in this GitHub repository.
1. Input
For this step, you configure the source for what you’re monitoring. It might be a log file, Docker event, etc. In this example, my source is Apache2’s access log file.
[Apache2AccessLogInput]
type = "LogstreamerInput"
log_directory = "/var/log/apache2"
file_match = 'access\.log'
ticker_interval = 5
decoder = "Apache2LogDecoder"
The first line, with the square brackets, specifies the name you’ve given the plugin you’re defining for the step. You can also use the type as the name and hence won’t be required to define the type as a field below the name. I used the ‘LogStreamerInput’ type to handle for my input plugin. I also had to specify which decoder plugin (described in the next sub-section) I want coupled with the input plugin. Pretty straightforward.
2. Decode
The decoder plugin translates the input gotten by the input plugin to something that can be processed by the plugins that follow it.
[Apache2LogDecoder]
type = "SandboxDecoder"
filename = "lua_decoders/apache_access.lua"
    [Apache2LogDecoder.config]
    user_agent_transform = false
    log_format = "%h %l %u %t \"%r\" %>s %O \"%{Referer}i\" \"%{User-Agent}i\""
The name you give the decoder plugin has to be consistent with the one defined as the decoder in the input plugin. For the SandboxDecoder type, you also have to provide the file in which the plugin type is defined.
There is a set of files that define types that come bundled with Heka in /usr/share/heka. I, for instance, used the /usr/share/heka/lua_decoders/apache_access.lua file that defines a SandboxDecoder type. Another cool thing about Heka, you can define your own plugin types and point to where you’ve defined them in your config files.
3. Filter
You might want to filter out decoded data that you consider unnecessary in your filter plugin.
[Apache2HTTPStatusFilter]
type = "SandboxFilter"
filename = "lua_filters/http_status.lua"
ticker_interval = 5
preserve_data = false
message_matcher = "Type == 'logfile'"
    [Apache2HTTPStatusFilter.config]
    sec_per_row = 60
    rows = 1440
    preservation_version = 14
Some meta-variables are appended to the monitoring data by the decoder plugin depending on the type of decoder used. For instance, the SandboxDecoder in lua_decoders/apache_access.lua appends the Type meta-variable to the decoded data. You can use these variables to filter out the data you need–because a lot of data is decoded and you might not want to store all of it. Check the decoder type documentation for the full list of appended variables. I only needed data that had the Type set to ’logfile’ so I defined this in the message_matcher field.
Tip: I initially set the message_matcher field to “TRUE” so that none of the data was actually filtered out then checked the output to see what I could use to filter out the data.
4. Encode
You need to define an encoder plugin for encoding the data to a form that can be processed by whatever you are outputting to. This might be as simple as defining the type for the encoder plugin.
[Apache2HTTPStatusInfluxDBEncoder]
type = "SandboxEncoder"
filename = "lua_encoders/schema_influx_line.lua"
    [Apache2HTTPStatusInfluxDBEncoder.config]
    timestamp_precision= "s"
5. Output
Finally, you need to define the output plugin. I am sending the data to an InfluxDB database so I had to define a plugin for this purpose.
[Apache2HTTPStatusInfluxDBOutput]
type = "HttpOutput"
message_matcher = "Type == 'logfile'"
address = "http://127.0.0.1:8086/write?db=a2_access_log&rp=default&precision=s"
username = "root"
password = "root"
encoder = "Apache2HTTPStatusInfluxDBEncoder"
You can define more than one output plugin (you can probably also do this for some of the other steps). I wanted to log the output, during testing, so that I didn’t have to query InfluxDB for the data.
[LogOutput]
message_matcher = "Type == 'logfile'"
encoder = "Apache2HTTPStatusInfluxDBEncoder"
Conclusion
I love the setup so far:
- No processor hogging observed.
- The Heka, InfluxDB, and Grafana services have been running continuously for a month now without farting or dying on me.
- InfluxDB isn’t using a lot of disk space. The database storing HTTP status codes is 900K on the disk, one month on.
- The graphs on Grafana look sexy. Here’s a screenshot of the graphs on HTTP status codes: